Nuna
An Operations Dashboard for processing Medicaid data from ~70 million lives across 50 states and 7 territories.

Overview
Nuna's Government Services Division worked directly with the Centers for Medicare and Medicaid Services (CMS). I led design on the Operations Dashboard — a system used to ingest, error-check, and manage Medicaid data covering approximately 70 million lives, submitted by all 50 states and 7 U.S. territories.
The Mandate
In 2013, CMS mandated that all states and territories begin submitting Medicaid data in the new standardized T-MSIS format. This modernized how states submitted beneficiary, provider, claims, and encounter data — but also placed enormous pressure on the infrastructure that received it.
Challenge
The existing ingestion system was slow and opaque. Processing a 92GB file could take up to a week. States had no visibility into their submission status, no acknowledgment of receipt, and no way to know whether their data had passed validation. Our team needed to rebuild the pipeline to be fast and reliable, and build a dashboard on top of it that both Nuna operators and state users could trust.

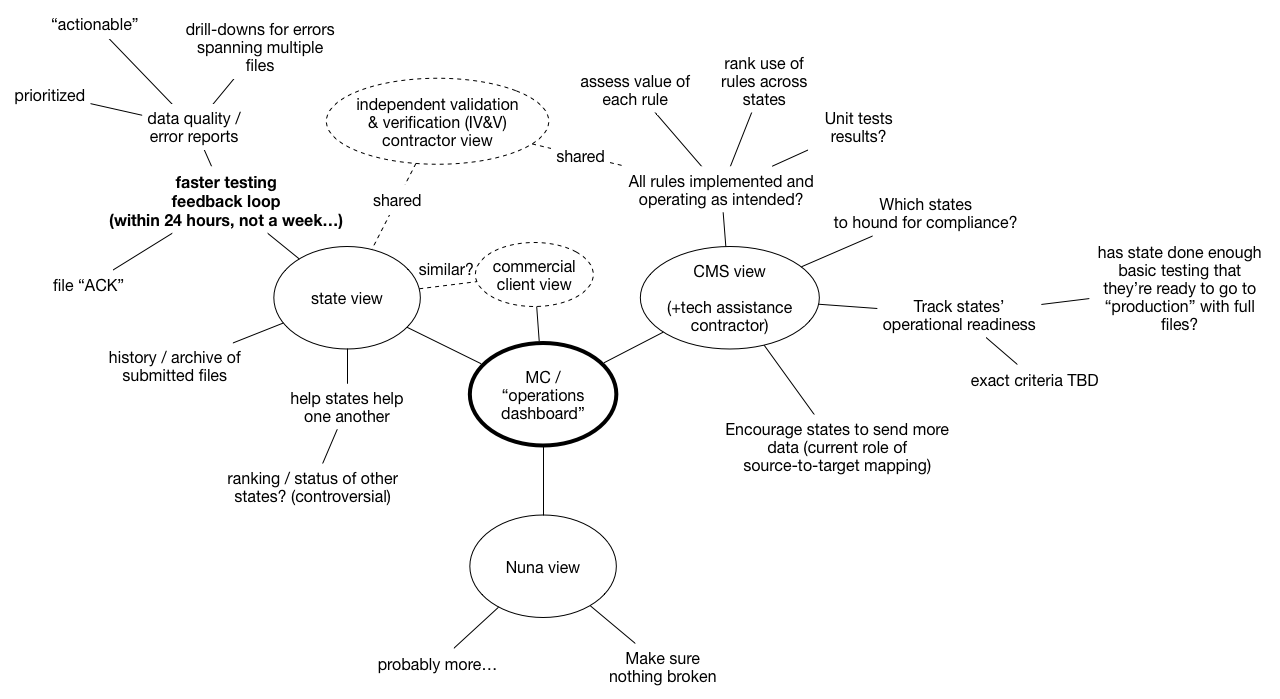
Understanding the Ecosystem
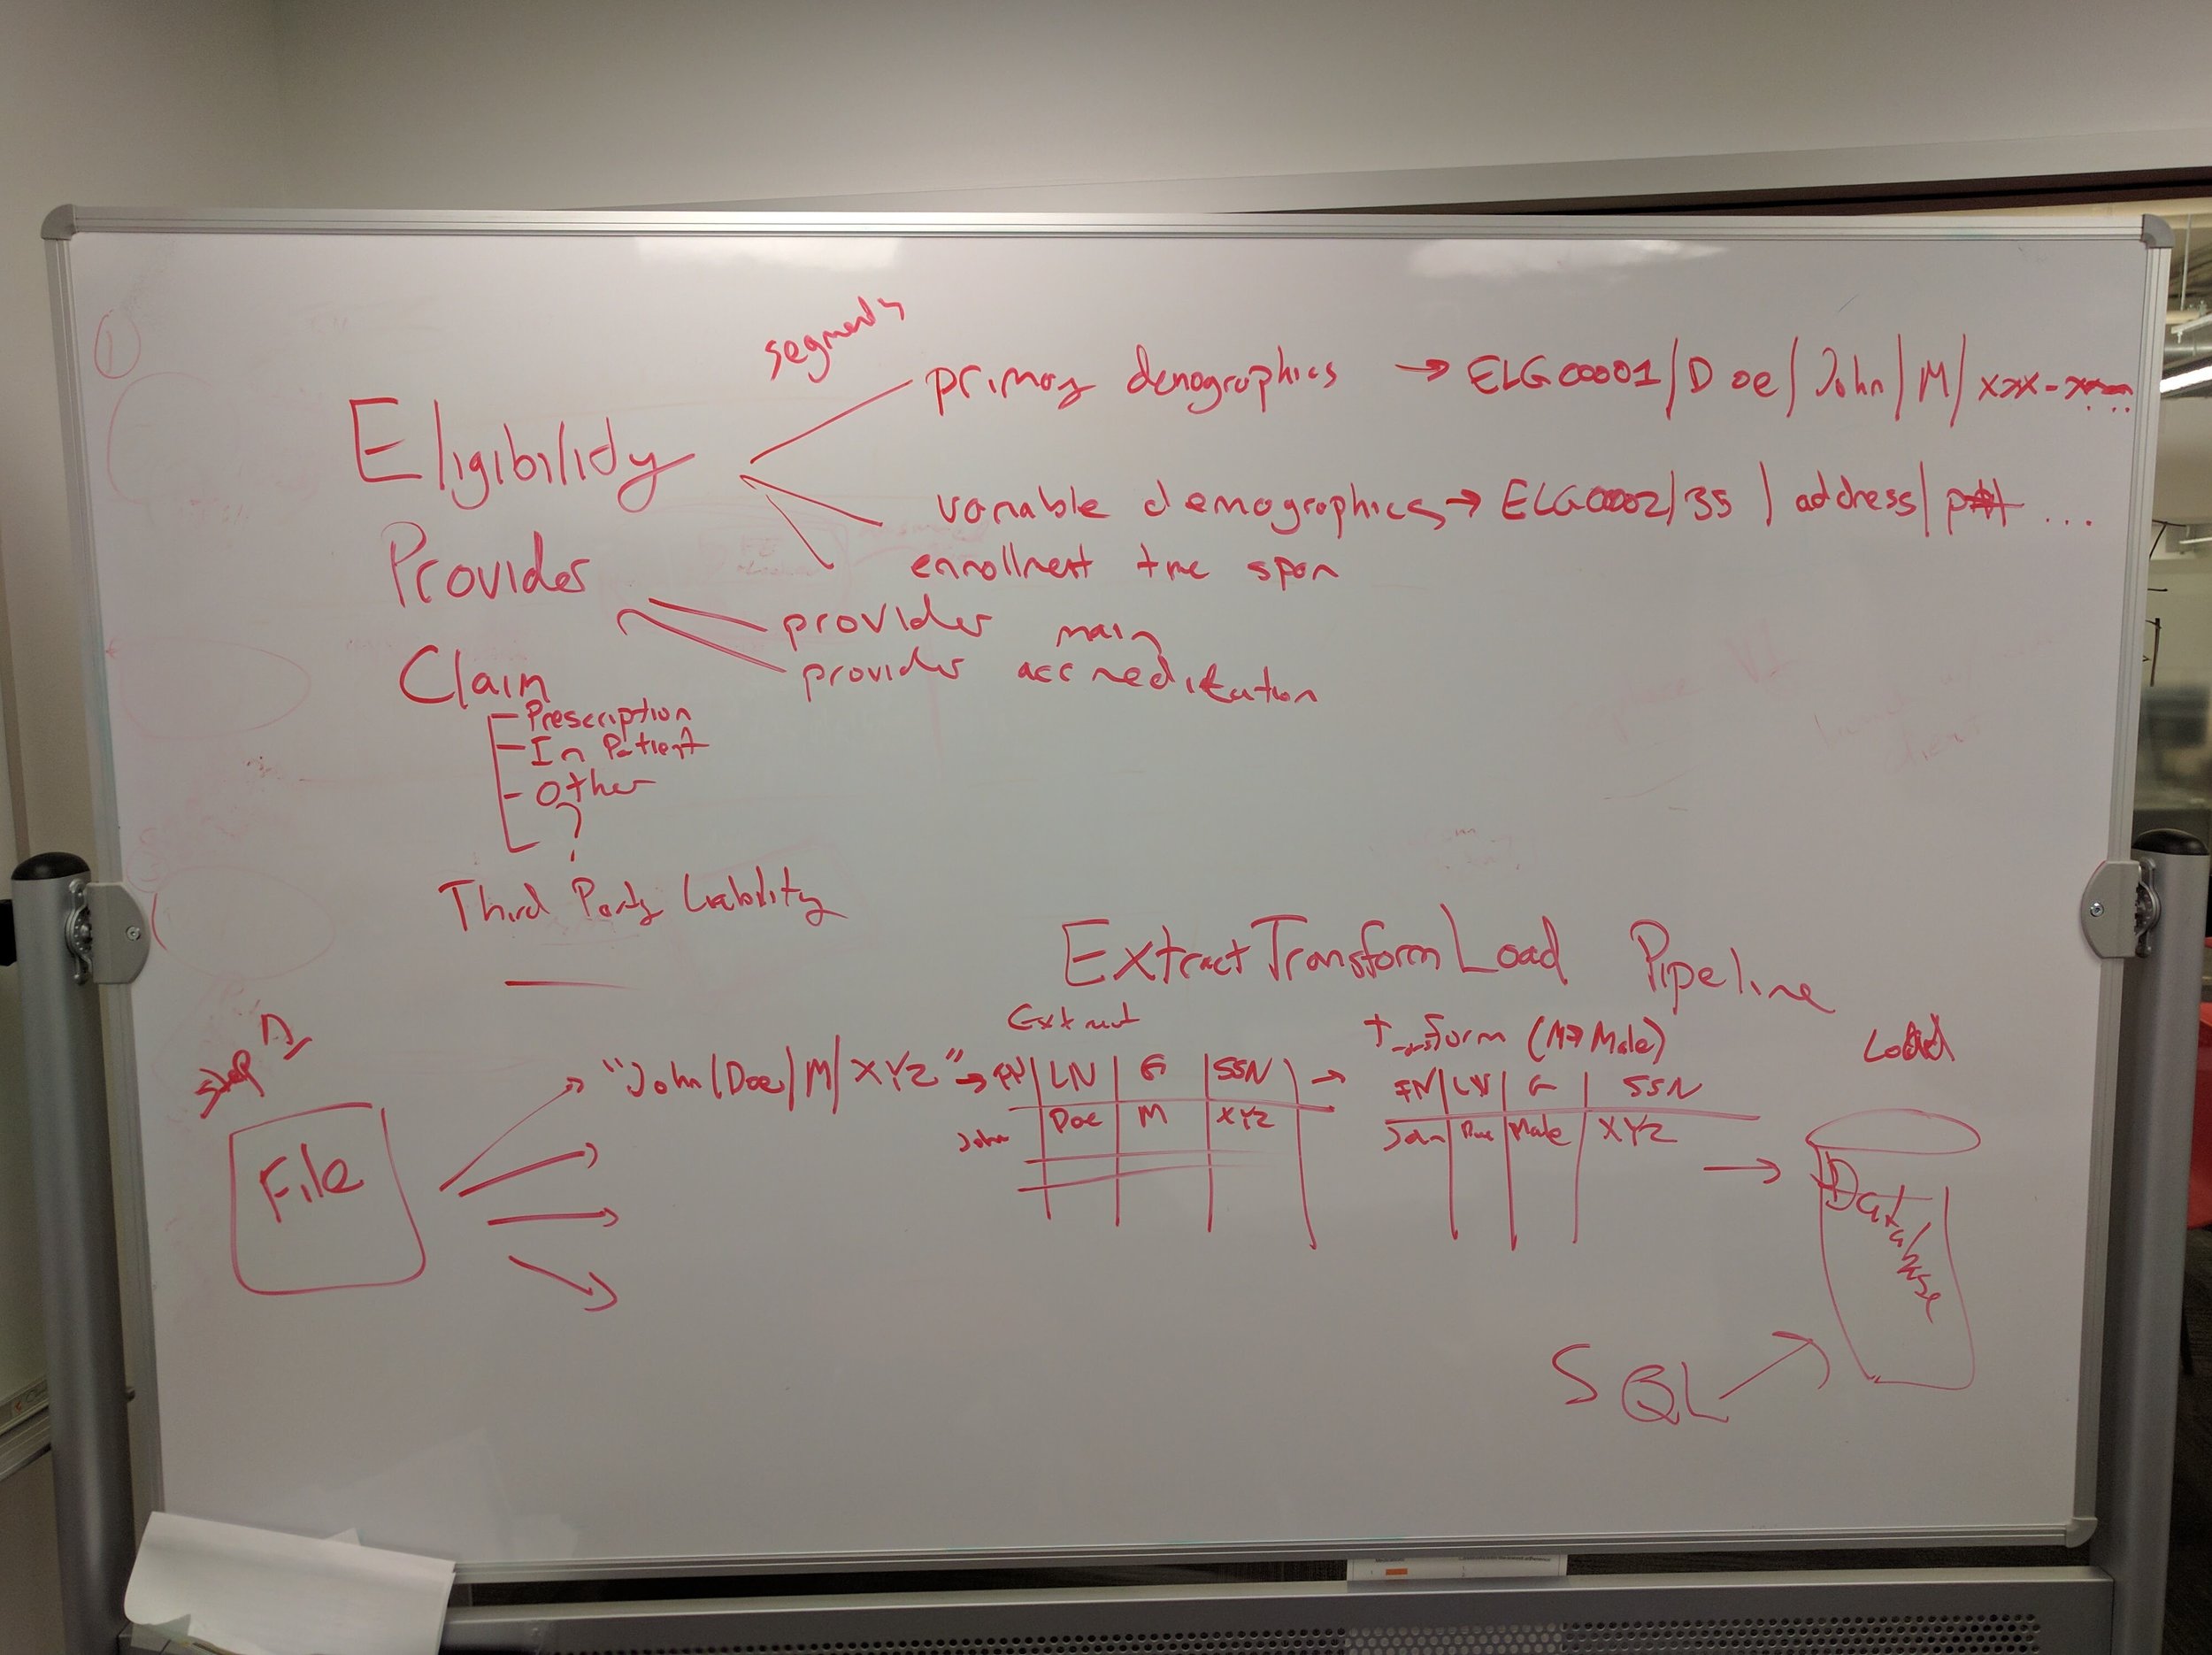
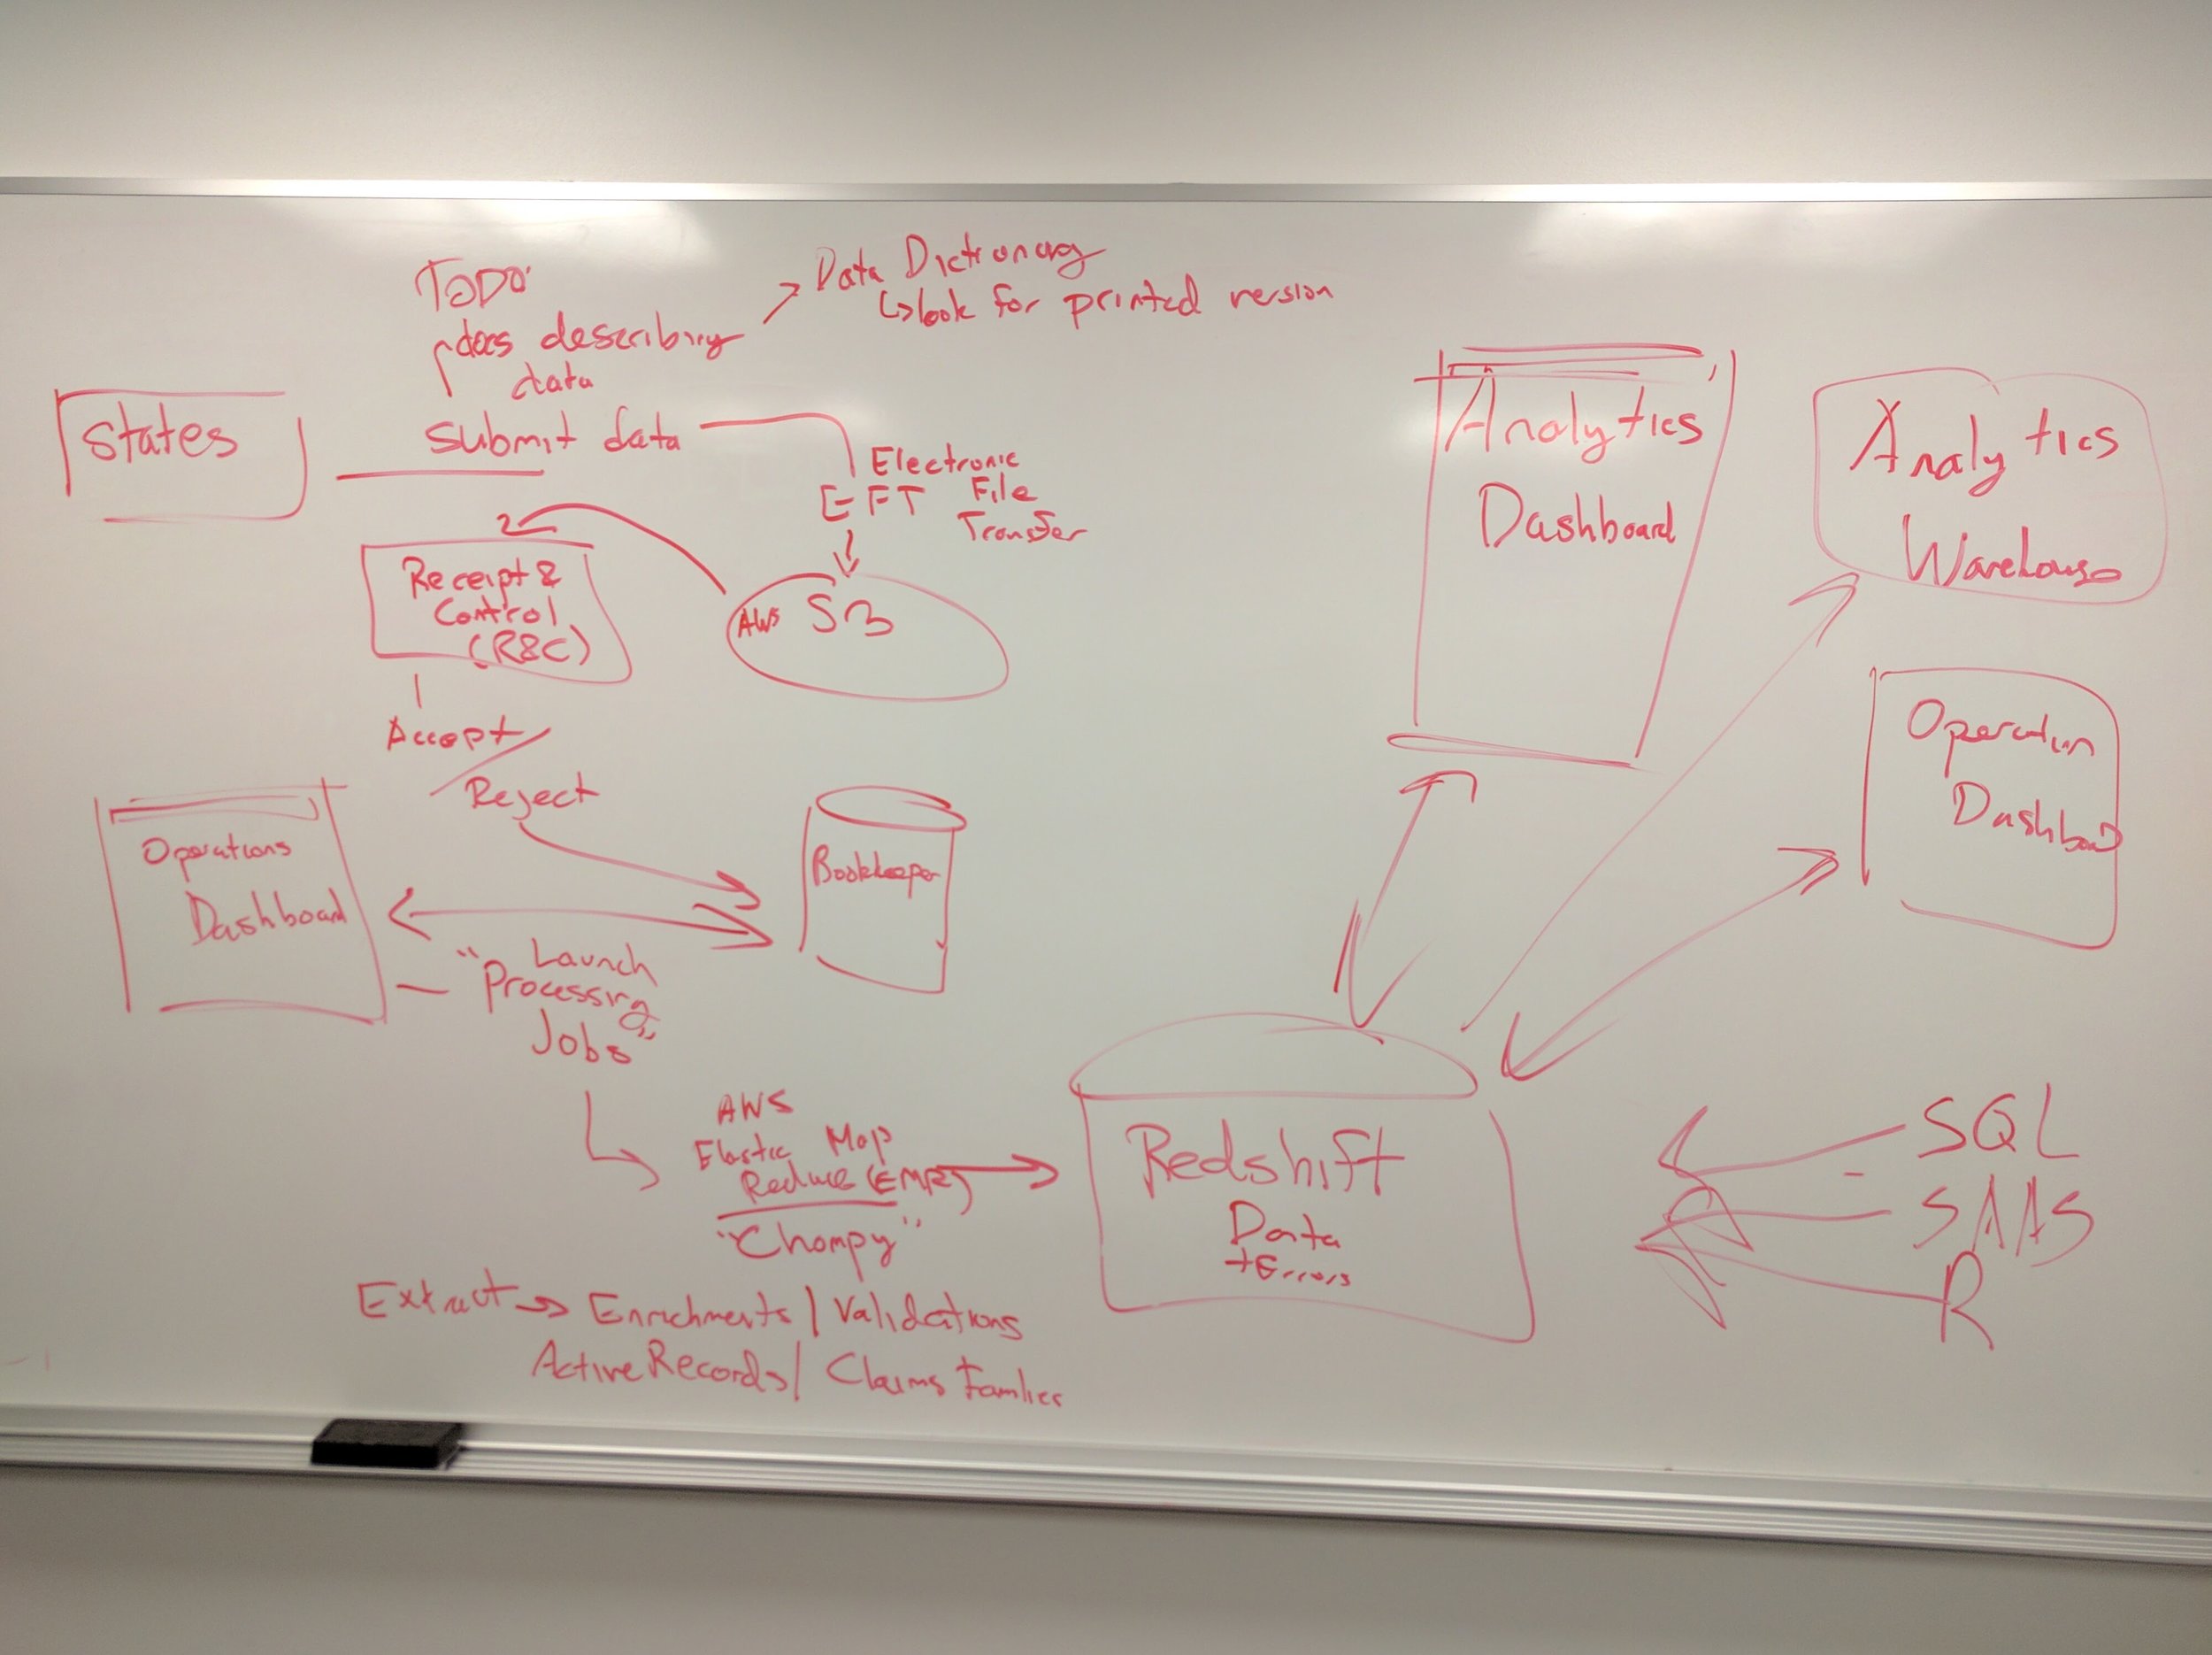
I started with discovery across the entire pipeline — talking with subject matter experts about what a T-MSIS file actually contains, how it flows through the data warehouse, and where things usually broke down. Because we had limited direct access to state users, we built personas from stakeholder interviews to ground our design decisions.

Wireframing
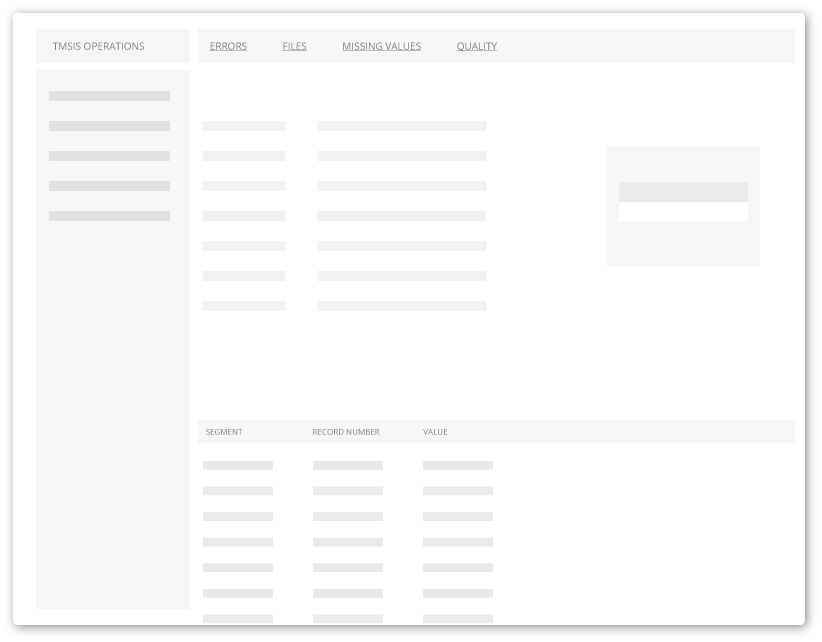
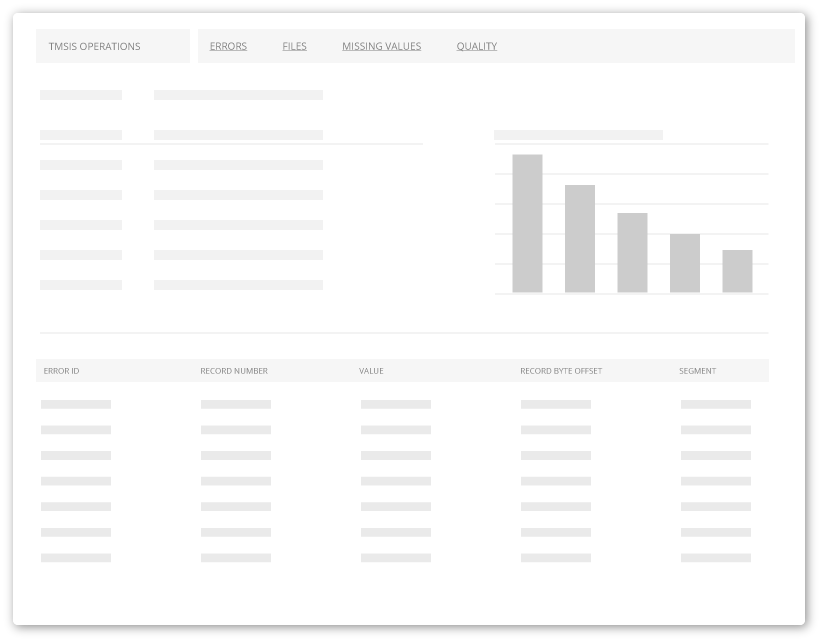
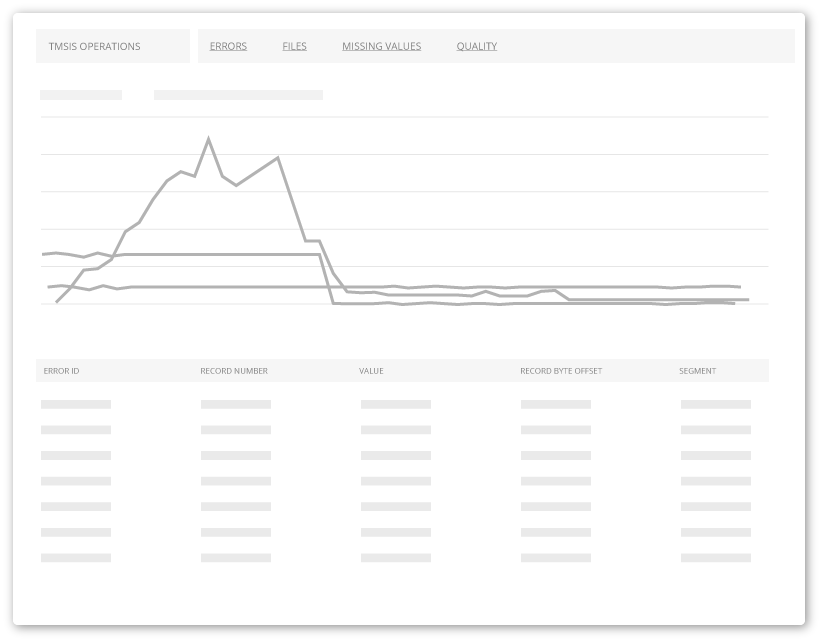
I built rough Sketch wireframes to organize the layout and user flows for what was becoming a very complex application — ingestion status, quality reports, issue investigation, and state-by-state comparison all needed to coexist without overwhelming users.
Refinement
The final design uses a scalable, multi-level navigation that leaves room for future feature expansion. Operators can drill from a fleet-wide view of all 57 jurisdictions down into a single file's quality report in a handful of clicks.
Outcome
I presented an Axure prototype at CMS headquarters in Baltimore. The reception was exceptional — enough to make it into production planning almost immediately. Today, 42 states use the Operations Dashboard in full production.